Assembly
An Assembly is a hardware-dependent test setup that is registered in vHaaS and can be booked for test execution. It bundles all the hardware needed to run tests against a target — the devices under test and the equipment to control and observe them — into a single, reservable unit that engineers and CI systems can allocate on demand.
The following image shows an Assembly mounted on a single carrier plate, with its central control unit, evaluation boards, debugger, and network devices wired together into one reservable unit.
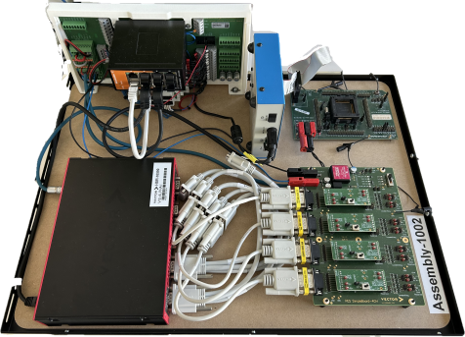
Every Assembly is identified by an Assembly reference in the form ASSEMBLY-<number>
(for example ASSEMBLY-100) together with a human-readable name.
How Assemblies are organized
An Assembly does not run on its own — it is hosted on a Cluster, the
physical unit that provides the PCs and infrastructure. A Cluster hosts at least one virtual
Assembly and can host multiple physical Assemblies. An Assembly is either connected to a Cluster
(making it bookable) or on stock in storage.
An Assembly has always a status, that determines whether and how it can be booked — see Assembly statuses for what each status means and how to book it.
Who can see and book an Assembly is controlled separately from where it is hosted: an Assembly is shared with Groups, or made visible to a whole Organization. See Organization and Visibility Structure.
Assembly components
A physical Assembly combines a central control unit with the devices under test and the equipment needed to drive them:
- Hardware Automation Interface (HAI) — a network-addressable control unit (the HAI.Gen2) that is always part of a physical Assembly. It covers three core functions: switching connected devices on and off, monitoring their electrical state (current, voltage, and power per channel), and setting up the test configuration through optional relay and multiplexer extension boards.
- Evaluation board — the target hardware with the CPU under test.
- Debugger — for controlling and analyzing the embedded system (e.g. Tasking/iSystem or Lauterbach).
- Network interfaces — Vector VN, VH, or VT devices for the relevant bus and network systems.
- Other devices — auxiliary equipment such as logic analyzers, oscilloscopes, or network transceivers.
The physical wiring of an Assembly can be reconfigured without disassembly, which lets a single Assembly cover more use cases — improving availability, reducing waiting times, and speeding up development:
- Channel Multiplexing — an optional multiplexer board that switches a peripheral between preconfigured, mutually exclusive connections (a 1:4 topology). Only one connection is active at a time, which makes it ideal for selecting between variants such as different transceivers.
- Relay Card & Jumpers — an optional relay card (from HAI.Gen2 onwards) adds several independently switchable channels that route signals to devices or signal lines (for example 5 V, GND, or an open line). Unlike multiplexing, channels can be switched non-exclusively — several at once — which is useful for controlling extra devices beyond the HAI's own channels or for simulating faults such as line breaks. Jumpers are physical short-circuit connectors that route a HAI channel to a specific device or signal, again without any disassembly.
Both extension types connect to the HAI.Gen2, are integrated at Assembly level by the vHaaS Cluster Service Team, and are controlled through the HAI. See the HAI.Gen2 page for the full extension-board details.
Hardware Automation Interface Generation 2 (HAI.Gen2)
For remote control of Assembly devices, a network-addressable remote-control unit is essential. Therefore, a hardware automation interface (HAI) is always an integral part of an Assembly, which controls its devices. In vHaaS Assemblies, this role is filled by the HAI.Gen2.
A REST interface provides access to the HAI feature set. The vHaaS proxy is the primary user of this interface. When using CANoe, you can also use the .NET Assembly Manager software component for test-automated control and monitoring purposes.
Overview
HAI.Gen2 has a modular design consisting of a controller board and an application board tailored to specific requirements.
The application board offers:
- Switching of up to ten devices, each with a maximum current of 7 A
- Per-device current, voltage, and power recording
- Optional relay and multiplexer extension boards via two I2C interfaces — see Channel Multiplexing and Relay Card & Jumpers on the HAI.Gen2 page
- Integration of I2C sensors and actuators for simple Assembly measurement tasks, including from CANoe tests
- Two digital inputs for a board status pin (virtual LED) and I2C sensor alert line
- An optional plug-and-play display for local control of connected boards and display of measured values, status, and debug information
- Two piggy sockets for future extensions
For maintainers, the application board also provides input power supply LEDs, device switching state indicators, rack operating status LEDs, a local power supply connector for auxiliary equipment (e.g., logic analyzer or oscilloscope) that doesn't affect HAI monitoring, and extended debug/status output via the optional display.
Channels
HAI.Gen2 exposes 10 controlled device channels (0–9). Each channel switches one device output and has a dedicated power sensor that measures voltage and current. These measurements can be retrieved from the Monitoring view.
Status LED
The onboard status LED indicates the current device state:
| Pattern | Meaning |
|---|---|
| Yellow (solid, startup) | Hardware initialization |
| Blue (solid, startup) | System configuration (EEPROM parameters, board settings, power setup) |
| Violet (solid, startup) | Network services starting up |
| Green (flashing) | Normal operation, Assembly free (no active session) |
| Blue (flashing) | Normal operation, Assembly session active |
| Red (solid) | Fault — device not operating normally |
Note
The distinction between flashing green (no active session) and flashing blue (session active) reflects vHaaS session state layered on top of the device's normal-operation indication.
A dedicated LED next to each device connector also lights up as soon as the corresponding channel is switched on.
Evaluation Board
For hardware-dependent software components, testing on the target hardware remains essential. The test engineer can reserve an Assembly with the necessary evaluation board and installed CPU to execute tests easily and automatically.
The evaluation board status is an important element for monitoring. A predefined pin, which is toggled at runtime via vBaseEnv, can be connected to the HAI.
Depending on the board state, the monitoring section in the Web UI displays one of the following statuses:
- Board alive
- Board down
- Digital Status LED not connected
- Digital Status LED connection not possible
Details on connecting to the evaluation board and the connected components are documented in the Assembly Profile and can be viewed in the Assembly View under Visualization in vHaaS.
Debugger
For critical tasks such as monitoring, controlling, and analyzing embedded system behavior during development and testing, a debugger is an essential tool.
Within the vHaaS environment, the most commonly used debuggers are:
- Tasking (formerly known as iSystem)
- Lauterbach
Debugger Configuration:
To use these debuggers effectively with vHaaS, refer to the respective setup guides provided by the tool vendors:
Tasking (iSystem): Hardware Configuration Tutorial – winIDEA Help
Lauterbach: Installation Guide – Lauterbach
These guides provide step-by-step instructions for connecting and configuring the debuggers for use with vHaaS.
Network Interfaces
For testing and validation of software components, network interfaces are essential. Depending on the software under test (SUT) and available bus and network systems on the evaluation board, different network interface products from the Vector families VN, VH, and VT are integrated on the Assembly.
A detailed overview of network interfaces and their user manuals is available at vector.com: Network Interfaces.
Other Devices
In addition to the main devices, Assemblies may include auxiliary equipment for specialized tasks, such as:
- Logic Analyzer: for capturing and analyzing digital signal activity
- PicoScope: a compact oscilloscope for high-resolution signal inspection
- Network Transceiver: for interfacing with and analyzing communication protocols
Visualization in vHaaS
The Setup tab of the Assembly view shows a generated diagram of the Assembly — produced by the Assembly Visualizer — so you can see its devices, connections, and power supply at a glance. The diagram is generated from the Assembly Profile, so only information contained in the profile can be shown. You can use the filter options to choose which bus connections and infrastructure elements are displayed.
Info
If information is missing from the diagram (e.g. connections or pin details), or the visualization is faulty, request an update on the support page.
Every Assembly has a JSON description called the Assembly Profile, which captures the Assembly and all its devices, connections, and multiplexers. The profile is the data model that the Web UI controls and the Visualizer are derived from. Creating and maintaining it is the task of vHaaS maintainers.
Monitoring
vHaaS shows Assembly monitoring data in two places:
- Assembly dashboard — the Assembly's main view shows the live current-consumption chart, with devices mapped to power lines, for a health check at a glance.
- Monitoring tab — the full set of live per-device metrics: current and amperage per channel, the HAI.Gen2 connection status, and — depending on the setup — the evaluation board status pin.
For an overview of vHaaS monitoring and how to interpret this data, see Monitoring.
Assembly Consumption Panel
The Assembly consumption panel displays the current consumption of all Assembly devices. The system provides a time-based graph of power consumption, enabling analysis of energy usage. Each plotted curve represents a specific connected device with a distinct color. It is also possible zooming into the graph to identify potential issues.
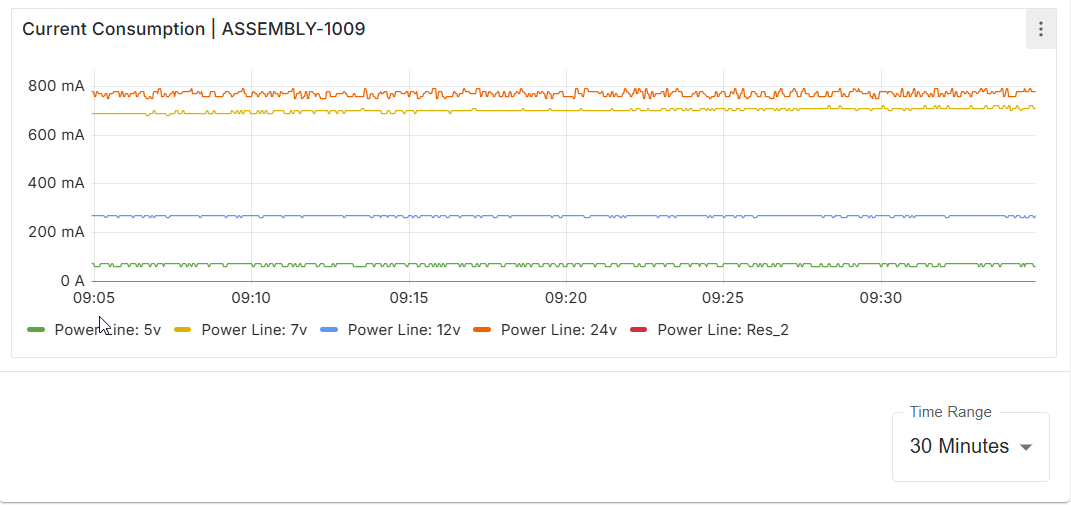
Assembly consumption panel.
The time range displayed in the consumption graph can be configured by selecting the desired interval from the dropdown menu located beneath the consumption window.
Related Topics
- Organization and Visibility Structure — who can see and book an Assembly
- Assembly Profile — the JSON data model behind an Assembly
- Monitoring — observing an Assembly's system and embedded hardware metrics
- Book an Assembly — reserve an Assembly for a session